Wednesday, November 11, 2020

Crop reports


Corn production down 1 percent from October forecast.
Soybean Production Down 2 Percent
Cotton Production Up less than 1 Percent


Corn production for grain is forecast at 14.5 billion bushels. Soybean production for beans is forecast at 4.17 billion bushels. All cotton production is forecast at 17.1 million 480-pound bales

Saturday, November 7, 2020

Election week catch up

 Construction spending during September 2020 was estimated at a seasonally adjusted annual rate of $1,414.0 billion, 0.3 percent above the revised August estimate of $1,410.4 billion.  During the first nine months of this year, construction spending amounted to $1,058.5 billion, 4.1 percent above the $1,016.7 billion for the same period in 2019.

Advance estimates of U.S. retail and food services sales for September 2020 were $549.3 billion, an increase of 1.9 percent from the previous month, and 5.4 percent above September 2019. Total sales for the July 2020 through September 2020 period were up 3.6 percent from the same period a year ago. 

The nation's international trade deficit in goods and services decreased to $63.9 billion in September from $67.0 billion in August (revised), as exports increased more than imports.

September 2020 sales of wholesalers were $486.0 billion, little changed from the August level, but were down 2.3 percent from  September 2019.

Nonfarm business sector labor productivity increased 4.9 percent in the third quarter of 2020. The 4.9-percent gain in productivity in the third quarter was the second consecutive large increase in the measure—productivity had increased 10.6 percent in the second quarter of 2020. 

Total nonfarm payroll employment rose by 638,000 in October, and the unemployment rate 
declined to 6.9 percent, the U.S. Bureau of Labor Statistics reported today. These 
improvements in the labor market reflect the continued resumption of economic activity that 
had been curtailed due to the coronavirus (COVID-19).

Consumer credit increased at a seasonally adjusted annual rate of 2-1/4 percent during the 
third quarter. Revolving credit decreased at an annual rate of 2-1/2 percent, while nonrevolving 
credit increased at an annual rate of 4 percent. In September, revolving credit increased at 
an annual rate of 4-3/4 percent, while nonrevolving credit increased at an annual rate of 
4-3/4 percent.

Friday, October 30, 2020

Compensation costs for civilian workers increased 0.5 percent, seasonally adjusted, in the 3-month period ending in September 2020. Wages and salaries increased 0.4 percent and benefit costs increased 0.6 percent.

Personal income increased $170.3 billion (0.9 percent) in September. Disposable personal income (DPI) increased $150.3 billion (0.9 percent) and personal consumption expenditures (PCE) increased $201.4 billion (1.4 percent).

The September Prices Received Index 2011 Base (Agricultural Production), at 89.0, increased 0.9 percent from August and 1.1 percent from September 2019. The Crop Production Index was up 1.3 percent from last month and 5.9 percent from September 2019. The Livestock Production Index increased 0.2 percent from August, but decreased 3.7 percent from September 2019.

Farmers received higher prices during September for lettuce, hogs, corn, and soybeans but lower prices for milk, broilers, potatoes, and hay. In addition to prices, the indexes are influenced by the volume change of commodities producers market; in September, there was increased monthly volume for soybeans, corn, apples, and dry beans and decreased sales of cattle, wheat, cotton, and strawberries.

Thursday, October 29, 2020

After bounce economy still producing less

Real gross domestic product (GDP) increased at an annual rate of 33.1 percent in the third quarter of 2020, according to the advance estimate released by the Bureau of Economic Analysis. In the second quarter, real GDP decreased 31.4 percent.

To put this in perspective, at the end of 2019, the US had a $19.25 trillion economy. After the third-quarter rebound, the US had an $18.58 trillion economy.

Tuesday, October 27, 2020

Durable goods manufacturing stabilizing?

New orders for manufactured durable goods in September increased 1.9 percent to $237.1 billion, the U.S. Census Bureau announced today. This increase followed a 0.4 percent August increase and was the fifth uptick in a row. Although the May, June, and July increases were substantially higher than in the past 2 months, the massive declines in March and April mean the year-to-date level of durable good orders are fully 10 percent below the same 9 months of 2019. Perhaps durable good orders are now in a "New Normal" pattern that is lower than the "normal" normal?

Monday, October 26, 2020

New home sales rebound pauses for breath

Sales of new single-family houses in September 2020 were at a seasonally adjusted annual rate of 959,000, according to estimates released jointly today by the U.S. Census Bureau and the Department of Housing and Urban Development. This is not much changed from the revised August rate of 994,000, but is 32.1 percent above the September 2019 estimate of 726,000.

There were 284,000 new homes for sale at the end of September, about a 3.6 month supply at the current rate of sales.

Saturday, October 24, 2020

Cattle on feed at record level for October

Cattle and calves on feed for the slaughter market in the United States for feedlots with capacity of 1,000 or more head totaled 11.7 million head on October 1, 2020. The inventory was 4 percent above October 1, 2019. This is the highest October 1 inventory since the series began in 1996.

Thursday, October 22, 2020

Housing starts back to pre-pandemic patterns

Privately-owned housing starts in September were at a seasonally adjusted annual rate of 1,415,000. This is 1.9 percent above the revised August estimate of 1,388,000 and is 11.1 percent above September 2019. Over the past 5 months, housing starts have climbed out of the crater they were dropped into from January through April.

Wednesday, October 21, 2020

Playing a little catch up

The combined value of distributive trade sales and manufacturers’ shipments for August, adjusted for seasonal variation, was estimated at $1,452.4 billion, up 0.6 percent from July 2020, but down 0.4 percent from August 2019.

Manufacturers’ and trade inventories for August, adjusted for seasonal variations,were estimated at an end-of-month level of $1,919.2 billion, up 0.3 percent from July 2020, but down 5.5 percent from August 2019.

The total business inventories/sales ratio based on seasonally adjusted data was 1.32 at the end of August. The August 2019 ratio was 1.39.

U.S. retail and food services sales for September 2020 were $549.3 billion, an increase of 1.9 percent from the previous month and up 5.4 percent over September 2019

Industrial production fell 0.6 percent in September, its first decline after four consecutive months of gains. The index increased at an annual rate of 39.8 percent for the third quarter as a whole. Although production has recovered more than half of its February to April decline, the September reading was still 7.1 percent below its pre-pandemic February level.

Thursday, October 15, 2020

Import and export prices

U.S. import prices rose 0.3 percent in September following a 1.0-percent increase in August. Prices for U.S. exports advanced 0.6 percent in September, after rising 0.5 percent the previous month. Over the past year, import prices declined 1.1 percent and export prices fell 1.8 percent.

The U.S. terms of trade with China edged down 0.1 percent in September, the first monthly decline since the index fell 2.6 percent in April. In contrast, the index for U.S. terms of trade with China rose 0.4 percent over the past year. Terms of trade indexes measure the relative price of exports in terms of import prices. The index for China is calculated as the all-exports-to-China goods price index divided by the corresponding all-import goods price index on a scale of 100.

Wednesday, October 14, 2020

CPI, PPI, and real weekly earnings creep up in September

The Consumer Price Index for All Urban Consumers (CPI-U) increased 0.2 percent in September on a seasonally adjusted basis after rising 0.4 percent in August and 0.6 percent in July.

The Producer Price Index for final demand advanced 0.4 percent in September, seasonally adjusted. Final demand prices rose 0.3 percent in August and 0.6 percent in July. Within the intermediate demand category, prices for processed goods rose 1.0 percent and the index for unprocessed goods increased 3.9 percent.

Real average weekly earnings increased 0.2 percent in September as a 0.1 percent decline in real average hourly earnings combined with a 0.3-percent increase in the average workweek.

Friday, October 9, 2020

Wholesale inventories back in line with sales

Inventories/Sales Ratio: The August inventories/sales (I/S) ratio for merchant wholesalers, except manufacturers’ sales branches and offices, based on seasonally adjusted data, was 1.31. The August 2019 ratio was 1.35.

In April and May, the wholesale I/S ratios were 1.63 and 1.53, respectively. These values were substantially higher than any others posted in the past 10 years, and thus this indicator has returned to a more normal reading. Unfortunately, the sales base of the ratio, at $486.6 billion, is still 3-1/2 percent below its pre-pandemic level.

Wednesday, October 7, 2020

Revolving credit outstanding declines

In August, consumer credit decreased at a seasonally adjusted annual rate of 2 percent. Revolving credit decreased at an annual rate of 11-1/4 percent, while nonrevolving credit increased at an annual rate of 3/4 percent.

There is 3.3 as much outstanding nonrevolving credit, which includes motor vehicle loans and all other loans not included in revolving credit, such as loans for mobile homes, education, boats, trailers, or vacations, as outstanding revolving credit including "what's in your wallet."

Tuesday, October 6, 2020

Trade deficit widens in August

The U.S. Census Bureau and the U.S. Bureau of Economic Analysis announced today that the goods and services deficit was $67.1 billion in August, up $3.7 billion from $63.4 billion in July (as revised). The two agencies cannot say how much of this might be related to the pandemic because such impacts "are generally embedded in source data and cannot be separately identified." That they almost certainly exist is seen at https://www.bea.gov/system/files/inline-images/trad0820.png

Monday, October 5, 2020

I'm back

I'm starting this blog over in a more restrained format. I'll be making short remarks based on the official reports on the Principal Federal Economic Indicators (PFEI). On Friday, the U.S. Bureauof Labor Statistics (BLS) released the Employment Situation for September. At the top side, the unemployment rate "declined to 7.9 percent" and nonfarm payrolls declined by 661,000.

The most remarkable thing about the report was its this-is-just-another-data-point tone. A move of half a percentage point in the unemployment rate is Hope-diamond rare; there have been only five other such movements in the past two decades. In 2020, a half-point decline is treated in the press as a "slowdown" in what might well be what the Wall Street people call a dead-cat bounce after the 11.2 full percentage point increase between February and April.

None of these developments should be considered in the same light as more ordinary economic fluctuations. Their origin is in the public health policy in response to the CoVID-19 pandemic. The good news is that this will result in shorter posts in this blog. The bad news will appear tomorrow in A Slight Right.

Wednesday, August 31, 2011

Which end is in sight?

My absences grow longer, if not fonder. There hasn’t been much to excite any business cycle observer since my post at the end of last October. Despite some menacing feints, the economy has not slipped back into recession, but neither has it moved into a broad pattern of growth. The stubborn laggards are in housing and its related employment categories. The hesitant leaders are in factory production and its related utilization and productivity statistics.

As of August good news is outweighing bad by (very) roughly a 2-to-one margin. In my judgment, in really strong economy the ratio would be 4 (or more)-to- one. In our proprietary labor market index, there has been no sustained movement above a feeble upward trend that started at the end of 2009 and became evident in the moving averages in the first quarter of 2010. As of August, the labor market average was fractionally below its 6-month trailing moving average.

The economy’s stubborn insistence on sideways has caused me to wonder if there are deeper forces than the business cycle at work. A very thoughtful book by Robert D. Atkinson I recently reviewed for Monthly Labor Review (http://www.bls.gov/opub/mlr/2011/06/bookrevs.htm) is an interesting exploration of how longer waves of innovation affect the economy. My question is wheter or not we are at the fading end of the wave driven by the “entrepreneurial, knowledge-based” economy.

Earlier long waves have ended in tenacious recessions at intervals of about 50 years. By that timetable, the train is going off the rails a little early, but the computer revolution has speeded just about everything up, so why not its own long wave? Just thoughts.

Friday, October 29, 2010

Off the roller coaster?

I’m shocked to see that it’s been 3 months since I last posted. Yes, I’ve been busy, what with a fairly time consuming project with the Census Bureau to work on census coverage measurement and the renewal of thrice-a-week rugby coaching on the staff of my alma mater, but 3 months!

In the time since we last spoke, the National Bureau of Economic Research Business Cycle Dating Committee declared that June 2009 marked the trough of the recession. As readers of this blog know, NBER were very close to the truth; most likely there is no significant statistical or substantive difference between April and June. And so much for my nascent career as a BCD watcher.

Since NBER’s announcement, the economy went into a truly frightening stall. In the July 5 post, I was upset by a 9.9 index point drop in the Good News Index (GNI). Imagine how I would have felt if I had been paying attention the next month as the index fell by 33 points or the month after that as the 3-month moving average of the index dangled just fractions of a point above 50.

In September and October, the GNI moved back to the three-quarters to two-thirds range and the moving average came back to 63 and change in October. As I frantically worked to catch up on the index, I was heartened to see that there seems to be a growing flicker of life in the housing and related sectors, but less sanguine about the strength of the consumption-dependent sectors as consumers and lenders continue to restructure their revolving credit accounts.

The popping and only very slow reflation of what might be termed a conspicuous “consumption bubble” is a cycle that has been under-analyzed. How long will it be before a critical mass of consumers is willing to say, “I want that, and I’m willing to borrow to get it!”?

Monday, July 19, 2010

It's not whether or not you fall down, it's whether or not you get back up

Apparently, my renewed attention has not been sufficient to re-spark progress. Other than core prices remaining under control (a band of about half a percent either side of zero), the most recent reports have been worse than their immediate predecessors or were continued bad news.

Total nonfarm payroll employment declined by 125,000 in June, and the unemployment rate edged down to 9.5 percent. Our proprietary labor market index edged down for the first time in 4 months, and is desperately clinging to a place just above its trailing 6-month moving average. Mixed on the surface and neutral after an in-depth look.

Total construction activity for May 2010 was 0.2 percent below April. Bad.
Manufacturer’s shipments decreased 1.3 percent in May. New orders for manufactured goods decreased 1.4 percent. Bad.

May 2010 sales of merchant wholesalers were down 0.3 percent from April. Inventories were up 0.5 percent. Bad.

The Nation's international trade deficit in goods and services increased to $42.3 billion in May 2010, as imports increased more than exports. Bad, albeit for all the right reasons.

Retail and food service sales for June decreased -0.5 percent from the previous month. Bad.

Total business sales for May 2010 were down 0.9% from April. Bad.

The Producer Price Index for Finished Goods fell 0.5 percent in June. prices for finished goods rose 2.8 percent for the 12 months ended June 2010, their third straight month of slowing year-over-year advances. Good, especially as the monthly decline was strictly a food-and-energy thing.

The CPI declined 0.1 percent in June after falling 0.2 percent in May. The index for all items less food and energy increased 0.2 percent in June after increasing 0.1 percent in May. Good.

Real average weekly earnings fell 0.2 percent over the month of June. Bad.

Consumer credit decreased at an annual rate of 4-1/2 percent in May 2010. Bad.

Industrial production edged up 0.1 percent in June. The capacity utilization rate for total industry was unchanged. Neutral.

Import prices declined for the second consecutive month, dropping 1.3 percent in June. Export prices fell 0.2 percent. Neutral.

Monday, July 5, 2010

Stumbling through June

What’s up here? I get a good enough month at First XV Communications to put this blog on the back burner in June and things fall apart. The Good news index (GNI) fell by 9.9 index points during the month. Much of the accounting for the fall goes to the housing and related markets, but the rot seemed to be seeping into the durables factories as well. With the first major reports in July looking a bit dodgy as well (details in a later post), I guess I’ll just have to keep my nose to this particular grindstone, for the good of all.

In April 2010, wholesale trade edged up 0.7 percent over March. Good.

The Nation's international trade deficit in goods and services increased very slightly in April, as exports decreased more than imports. Bad all around.

Retail sales for May decreased -1.2 percent from the previous month. Bad.

Total business sales for April 2010 were up 0.6% from March. Good.

Manufacturing corporations' seasonally adjusted after-tax profits averaged 7.7 cents per dollar of sales for the first quarter of 2010, not statistically different from the fourth quarter of 2009. Neutral.

Housing starts in May 2010 10.0 percent below April. Awful.

After-tax profits for retail corporations averaged 3.0 cents per dollar of sales for the first quarter 2010, down 0.1 cents from the fourth quarter. Bad.

Sales of new one-family houses in May 2010 were 32.7 percent below the revised April rate. Truly awful.

New orders for manufactured durable goods decreased 1.1 percent in May. Alarmingly awful.

Import prices fell 0.6 percent in May. Fuel prices reversed the recent upward trend, falling 4.9 percent in May. In contrast to fuel prices, nonfuel prices continued to trend up in May, rising 0.5 percent. Everything is right on the knife edge between good and bad; rated as mixed or neutral.

The Producer Price Index for Finished Goods moved down 0.3 percent in May. Prices for finished goods rose 5.3 percent for the 12 months ended May 2010. This was the second consecutive month of slowing year-over-year advances. Good.

The Consumer Price Index for All Urban Consumers (CPI-U) declined 0.2
percent in May. The index for all items less food and energy increased 0.1 percent. Good.

Real average hourly earnings for all employees rose 0.5 percent from April to May. Real average weekly earnings rose 0.8 percent over the month. Good and better.

Real gross domestic product increased at a revised annual rate of 2.7 percent in the first quarter of 2010. Still good, but less good than we had thought.

Personal income and disposable personal income both increased 0.4 percent in May. Good.

Consumer credit increased at an annual rate of 1/2 percent in April 2010. Good.

Industrial production advanced 1.2 percent in May after having risen 0.7 percent in April. The capacity utilization rate for total industry rose 1.0 percentage point. Good.

Monday, May 31, 2010

A flowery end to May

The good news index (GNI), a measure of the diffusion of good headline numbers among a subset of the principal Federal economic indicators, rebounded strongly in May to reach 78.9 percent. This was the best month so far in the increasingly evident recovery.

As the evidence for recovery strengthens, I’ve become something of a NBER Business Cycle Dating Committee (NBCD) watcher. (NBCD watchers are something like Fed watchers, except more intellectual and better looking. To be fair, it must be noted that Fedwatchers are far more wealthy.)

Of the four NBCD members who have made easy-to-find statements about the possibility the economy is in a recovery, three made strong statements that it was their personal view that the economy has been in a recovery for some time. The fourth indicated that we should look at a longer sequence of positive reports before deciding.

In any case, we will stick by our December 4, 2009, call that the technical indicators we make or follow point to an April 2009 turning point. We’ll also stick to our call that the NBCD will not confirm the trough until nearly Christmas.

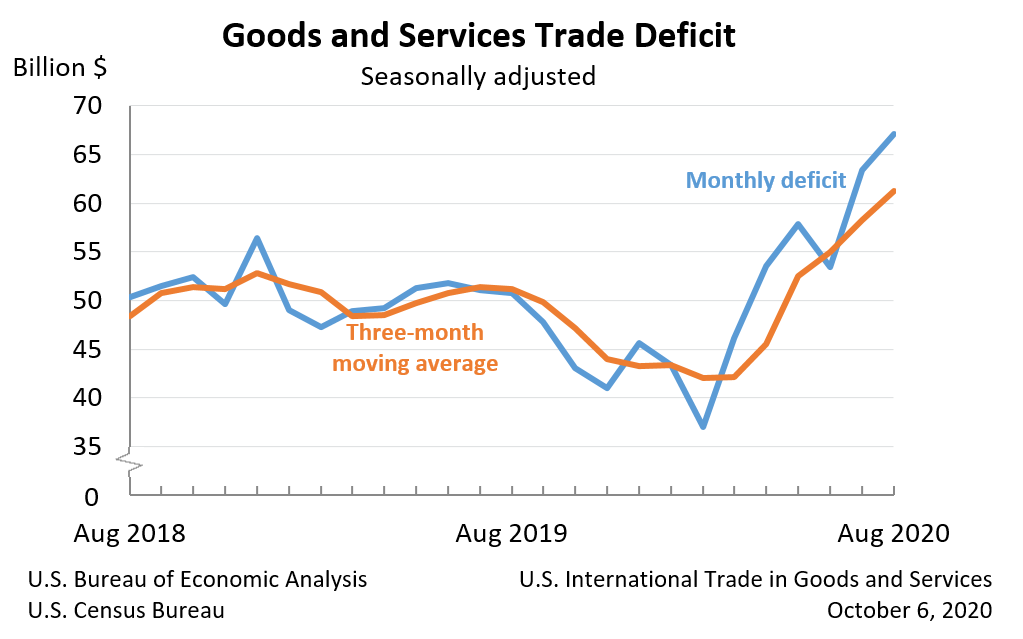
March exports rose to $147.9 billion but imports rose to $188.3 billion, resulting in a trade deficit of $40.4 billion, up from $39.4 billion in February. Two wrongs may not make a right, but two encouraging signs for demand can lead to a negative report; score a zero.

The price index for imports increased 0.9 percent in April. About 55 percent of the April increase was attributable to higher fuel prices. Nonfuel import prices rose 0.5 percent. Export prices increased 1.2 percent in April. The April advance was led by higher nonagricultural prices. Overall, this is just too much price inflation; score a zero.

U.S. retail and food service sales increased 0.4 percent from the previous month. Not a statistically significant change—score 0.5.

U.S. total business sales for March 2010 were up 2.3 percent from February. Good.
Industrial production increased 0.8 percent in April after having risen 0.2 percent in March. Good.

The Producer Price Index for Finished Goods declined 0.1 percent in April. At the earlier stages of processing, prices received by producers of intermediate goods moved up 0.8 percent and the crude goods index fell 1.2 percent. Good, on balance.

The CPI declined 0.1 percent in April after rising 0.1 percent in March. The index for all items less food and energy was unchanged in both March and April. Good.

Real average hourly earnings for all employees rose 0.1 percent from March to April. Real average weekly earnings rose 0.4 percent over the month. Good.

Sales of new one-family houses in April 2010 were at a seasonally adjusted annual rate 14.8 percent March. Good.

New orders for manufactured durable goods increased 2.9 percent in April. Good.

Real gross domestic product increased at a revised annual rate of 3.0 percent in the first quarter of 2010. The good news is muted a bit.

Personal income increased 0.4 percent in April. Personal consumption expenditures (PCE) increased $4.0 billion, or less than 0.1 percent. Mixed, albeit a good mix.