The combined value of distributive trade sales and manufacturers’ shipments for August, adjusted for seasonal
variation, was estimated at $1,452.4 billion, up 0.6 percent from July 2020, but down 0.4 percent from August 2019.
Manufacturers’ and trade inventories for August, adjusted for seasonal variations,were estimated at an end-of-month level of $1,919.2 billion, up 0.3 percent from July 2020, but down 5.5 percent from August 2019.
The total business inventories/sales ratio based on seasonally adjusted data was 1.32 at the end of August.
The August 2019 ratio was 1.39.
U.S. retail and food services sales for September 2020 were $549.3 billion, an increase of 1.9 percent from the previous month and up 5.4 percent over September 2019
Industrial production fell 0.6 percent in September, its first decline after four consecutive months of gains. The index increased at an annual rate of 39.8 percent for the third quarter as a whole. Although production has recovered more than half of its February to April decline, the September reading was still 7.1 percent below its pre-pandemic February level.
Wednesday, October 21, 2020

Thursday, October 15, 2020
Import and export prices
U.S. import prices rose 0.3 percent in September following a 1.0-percent increase in August. Prices for U.S. exports advanced 0.6 percent in September, after rising 0.5 percent the previous month. Over the past year, import prices declined 1.1 percent and export prices fell 1.8 percent.
The U.S. terms of trade with China edged down 0.1 percent in September, the first monthly decline since the index fell 2.6 percent in April. In contrast, the index for U.S. terms of trade with China rose 0.4 percent over the past year. Terms of trade indexes measure the relative price of exports in terms of import prices. The index for China is calculated as the all-exports-to-China goods price index divided by the corresponding all-import goods price index on a scale of 100.
The U.S. terms of trade with China edged down 0.1 percent in September, the first monthly decline since the index fell 2.6 percent in April. In contrast, the index for U.S. terms of trade with China rose 0.4 percent over the past year. Terms of trade indexes measure the relative price of exports in terms of import prices. The index for China is calculated as the all-exports-to-China goods price index divided by the corresponding all-import goods price index on a scale of 100.
Wednesday, October 14, 2020
CPI, PPI, and real weekly earnings creep up in September
The Consumer Price Index for All Urban Consumers (CPI-U) increased 0.2 percent in September on a seasonally adjusted basis after rising 0.4 percent in August and 0.6 percent in July.
The Producer Price Index for final demand advanced 0.4 percent in September, seasonally adjusted. Final demand prices rose 0.3 percent in August and 0.6 percent in July. Within the intermediate demand category, prices for processed goods rose 1.0 percent and the index for unprocessed goods increased 3.9 percent.
Real average weekly earnings increased 0.2 percent in September as a 0.1 percent decline in real average hourly earnings combined with a 0.3-percent increase in the average workweek.
The Producer Price Index for final demand advanced 0.4 percent in September, seasonally adjusted. Final demand prices rose 0.3 percent in August and 0.6 percent in July. Within the intermediate demand category, prices for processed goods rose 1.0 percent and the index for unprocessed goods increased 3.9 percent.
Real average weekly earnings increased 0.2 percent in September as a 0.1 percent decline in real average hourly earnings combined with a 0.3-percent increase in the average workweek.
Friday, October 9, 2020
Wholesale inventories back in line with sales
Inventories/Sales Ratio: The August inventories/sales (I/S) ratio for merchant wholesalers, except manufacturers’ sales branches and
offices, based on seasonally adjusted data, was 1.31. The August 2019 ratio was 1.35.
In April and May, the wholesale I/S ratios were 1.63 and 1.53, respectively. These values were substantially higher than any others posted in the past 10 years, and thus this indicator has returned to a more normal reading. Unfortunately, the sales base of the ratio, at $486.6 billion, is still 3-1/2 percent below its pre-pandemic level.
In April and May, the wholesale I/S ratios were 1.63 and 1.53, respectively. These values were substantially higher than any others posted in the past 10 years, and thus this indicator has returned to a more normal reading. Unfortunately, the sales base of the ratio, at $486.6 billion, is still 3-1/2 percent below its pre-pandemic level.
Wednesday, October 7, 2020
Revolving credit outstanding declines
In August, consumer credit decreased at a seasonally adjusted annual rate of 2 percent. Revolving credit decreased at an annual rate of 11-1/4 percent, while nonrevolving credit increased at an annual rate of 3/4 percent.
There is 3.3 as much outstanding nonrevolving credit, which includes motor vehicle loans and all other loans not included in revolving credit, such as loans for mobile homes, education, boats, trailers, or vacations, as outstanding revolving credit including "what's in your wallet."
There is 3.3 as much outstanding nonrevolving credit, which includes motor vehicle loans and all other loans not included in revolving credit, such as loans for mobile homes, education, boats, trailers, or vacations, as outstanding revolving credit including "what's in your wallet."
Tuesday, October 6, 2020
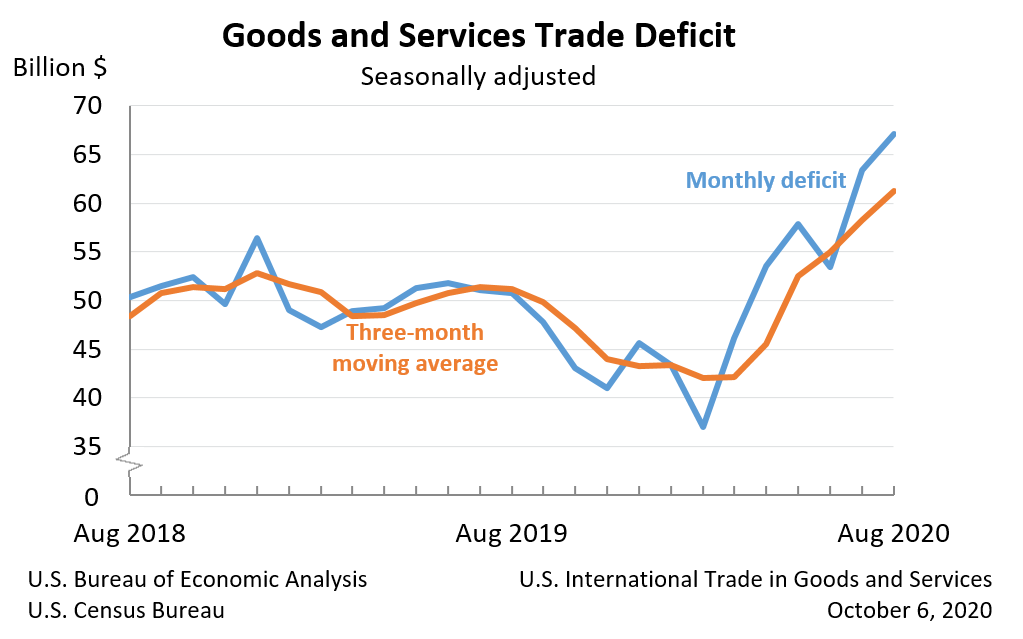
Trade deficit widens in August
The U.S. Census Bureau and the U.S. Bureau of Economic Analysis announced today that the goods and services deficit was $67.1 billion in August, up $3.7 billion from $63.4 billion in July (as revised). The two agencies cannot say how much of this might be related to the pandemic because such impacts "are generally embedded in source data and cannot be separately identified." That they almost certainly exist is seen at https://www.bea.gov/system/files/inline-images/trad0820.png
Monday, October 5, 2020
I'm back
I'm starting this blog over in a more restrained format. I'll be making short remarks based on the official reports on the Principal Federal Economic Indicators (PFEI). On Friday, the U.S. Bureauof Labor Statistics (BLS) released the Employment Situation for September.
At the top side, the unemployment rate "declined to 7.9 percent" and nonfarm payrolls declined by 661,000.
The most remarkable thing about the report was its this-is-just-another-data-point tone. A move of half a percentage point in the unemployment rate is Hope-diamond rare; there have been only five other such movements in the past two decades. In 2020, a half-point decline is treated in the press as a "slowdown" in what might well be what the Wall Street people call a dead-cat bounce after the 11.2 full percentage point increase between February and April.
None of these developments should be considered in the same light as more ordinary economic fluctuations. Their origin is in the public health policy in response to the CoVID-19 pandemic. The good news is that this will result in shorter posts in this blog. The bad news will appear tomorrow in A Slight Right.
The most remarkable thing about the report was its this-is-just-another-data-point tone. A move of half a percentage point in the unemployment rate is Hope-diamond rare; there have been only five other such movements in the past two decades. In 2020, a half-point decline is treated in the press as a "slowdown" in what might well be what the Wall Street people call a dead-cat bounce after the 11.2 full percentage point increase between February and April.
None of these developments should be considered in the same light as more ordinary economic fluctuations. Their origin is in the public health policy in response to the CoVID-19 pandemic. The good news is that this will result in shorter posts in this blog. The bad news will appear tomorrow in A Slight Right.
Subscribe to:
Posts (Atom)