The Consumer Price Index for All Urban Consumers (CPI-U) increased 0.2 percent in September on a seasonally adjusted basis after rising 0.4 percent in August and 0.6 percent in July.
The Producer Price Index for final demand advanced 0.4 percent in September, seasonally adjusted. Final demand prices rose 0.3
percent in August and 0.6 percent in July. Within the intermediate demand category, prices for processed goods rose 1.0 percent and the index for unprocessed goods increased 3.9 percent.
Real average weekly earnings increased 0.2 percent in September as a 0.1 percent decline in real average hourly earnings combined with a 0.3-percent increase in the average workweek.
Wednesday, October 14, 2020
Friday, October 9, 2020
Wholesale inventories back in line with sales
Inventories/Sales Ratio: The August inventories/sales (I/S) ratio for merchant wholesalers, except manufacturers’ sales branches and
offices, based on seasonally adjusted data, was 1.31. The August 2019 ratio was 1.35.
In April and May, the wholesale I/S ratios were 1.63 and 1.53, respectively. These values were substantially higher than any others posted in the past 10 years, and thus this indicator has returned to a more normal reading. Unfortunately, the sales base of the ratio, at $486.6 billion, is still 3-1/2 percent below its pre-pandemic level.
In April and May, the wholesale I/S ratios were 1.63 and 1.53, respectively. These values were substantially higher than any others posted in the past 10 years, and thus this indicator has returned to a more normal reading. Unfortunately, the sales base of the ratio, at $486.6 billion, is still 3-1/2 percent below its pre-pandemic level.
Wednesday, October 7, 2020
Revolving credit outstanding declines
In August, consumer credit decreased at a seasonally adjusted annual rate of 2 percent. Revolving credit decreased at an annual rate of 11-1/4 percent, while nonrevolving credit increased at an annual rate of 3/4 percent.
There is 3.3 as much outstanding nonrevolving credit, which includes motor vehicle loans and all other loans not included in revolving credit, such as loans for mobile homes, education, boats, trailers, or vacations, as outstanding revolving credit including "what's in your wallet."
There is 3.3 as much outstanding nonrevolving credit, which includes motor vehicle loans and all other loans not included in revolving credit, such as loans for mobile homes, education, boats, trailers, or vacations, as outstanding revolving credit including "what's in your wallet."
Tuesday, October 6, 2020
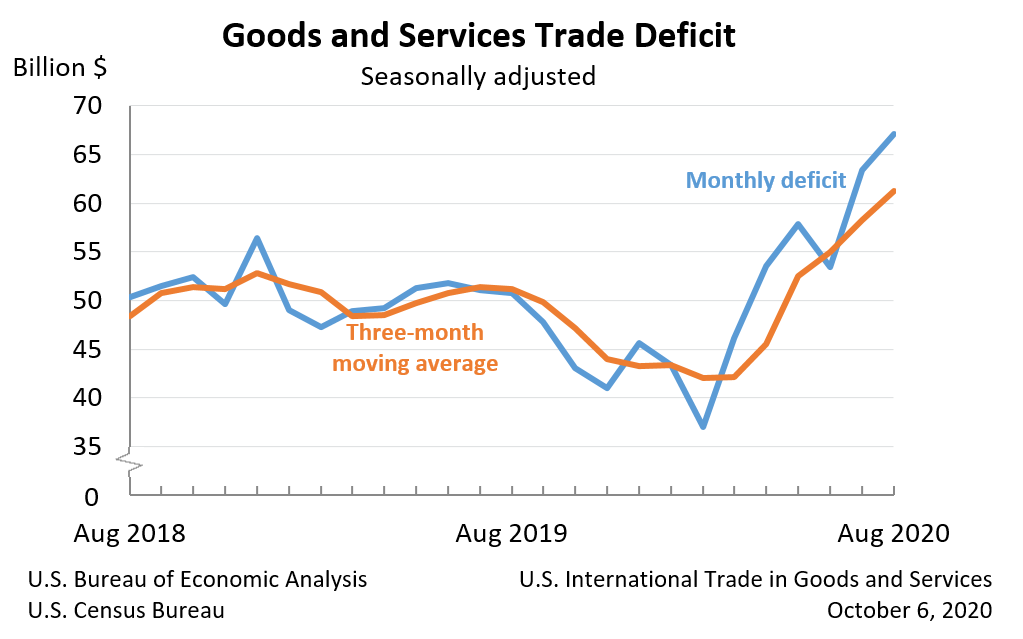
Trade deficit widens in August
The U.S. Census Bureau and the U.S. Bureau of Economic Analysis announced today that the goods and services deficit was $67.1 billion in August, up $3.7 billion from $63.4 billion in July (as revised). The two agencies cannot say how much of this might be related to the pandemic because such impacts "are generally embedded in source data and cannot be separately identified." That they almost certainly exist is seen at https://www.bea.gov/system/files/inline-images/trad0820.png
Monday, October 5, 2020
I'm back
I'm starting this blog over in a more restrained format. I'll be making short remarks based on the official reports on the Principal Federal Economic Indicators (PFEI). On Friday, the U.S. Bureauof Labor Statistics (BLS) released the Employment Situation for September.
At the top side, the unemployment rate "declined to 7.9 percent" and nonfarm payrolls declined by 661,000.
The most remarkable thing about the report was its this-is-just-another-data-point tone. A move of half a percentage point in the unemployment rate is Hope-diamond rare; there have been only five other such movements in the past two decades. In 2020, a half-point decline is treated in the press as a "slowdown" in what might well be what the Wall Street people call a dead-cat bounce after the 11.2 full percentage point increase between February and April.
None of these developments should be considered in the same light as more ordinary economic fluctuations. Their origin is in the public health policy in response to the CoVID-19 pandemic. The good news is that this will result in shorter posts in this blog. The bad news will appear tomorrow in A Slight Right.
Wednesday, August 31, 2011
Which end is in sight?
My absences grow longer, if not fonder. There hasn’t been much to excite any business cycle observer since my post at the end of last October. Despite some menacing feints, the economy has not slipped back into recession, but neither has it moved into a broad pattern of growth. The stubborn laggards are in housing and its related employment categories. The hesitant leaders are in factory production and its related utilization and productivity statistics.
As of August good news is outweighing bad by (very) roughly a 2-to-one margin. In my judgment, in really strong economy the ratio would be 4 (or more)-to- one. In our proprietary labor market index, there has been no sustained movement above a feeble upward trend that started at the end of 2009 and became evident in the moving averages in the first quarter of 2010. As of August, the labor market average was fractionally below its 6-month trailing moving average.
The economy’s stubborn insistence on sideways has caused me to wonder if there are deeper forces than the business cycle at work. A very thoughtful book by Robert D. Atkinson I recently reviewed for Monthly Labor Review (http://www.bls.gov/opub/mlr/2011/06/bookrevs.htm) is an interesting exploration of how longer waves of innovation affect the economy. My question is wheter or not we are at the fading end of the wave driven by the “entrepreneurial, knowledge-based” economy.
Earlier long waves have ended in tenacious recessions at intervals of about 50 years. By that timetable, the train is going off the rails a little early, but the computer revolution has speeded just about everything up, so why not its own long wave? Just thoughts.
Friday, October 29, 2010
Off the roller coaster?
I’m shocked to see that it’s been 3 months since I last posted. Yes, I’ve been busy, what with a fairly time consuming project with the Census Bureau to work on census coverage measurement and the renewal of thrice-a-week rugby coaching on the staff of my alma mater, but 3 months!
In the time since we last spoke, the National Bureau of Economic Research Business Cycle Dating Committee declared that June 2009 marked the trough of the recession. As readers of this blog know, NBER were very close to the truth; most likely there is no significant statistical or substantive difference between April and June. And so much for my nascent career as a BCD watcher.
Since NBER’s announcement, the economy went into a truly frightening stall. In the July 5 post, I was upset by a 9.9 index point drop in the Good News Index (GNI). Imagine how I would have felt if I had been paying attention the next month as the index fell by 33 points or the month after that as the 3-month moving average of the index dangled just fractions of a point above 50.
In September and October, the GNI moved back to the three-quarters to two-thirds range and the moving average came back to 63 and change in October. As I frantically worked to catch up on the index, I was heartened to see that there seems to be a growing flicker of life in the housing and related sectors, but less sanguine about the strength of the consumption-dependent sectors as consumers and lenders continue to restructure their revolving credit accounts.
The popping and only very slow reflation of what might be termed a conspicuous “consumption bubble” is a cycle that has been under-analyzed. How long will it be before a critical mass of consumers is willing to say, “I want that, and I’m willing to borrow to get it!”?
Subscribe to:
Posts (Atom)