In August, consumer credit decreased at a seasonally adjusted annual rate of 2 percent. Revolving credit decreased at an annual rate of 11-1/4 percent, while nonrevolving credit increased at an annual rate of 3/4 percent.
There is 3.3 as much outstanding nonrevolving credit, which includes motor vehicle loans and all other loans not included in revolving credit, such as loans for mobile homes, education, boats, trailers, or vacations, as outstanding revolving credit including "what's in your wallet."
Wednesday, October 7, 2020
Tuesday, October 6, 2020
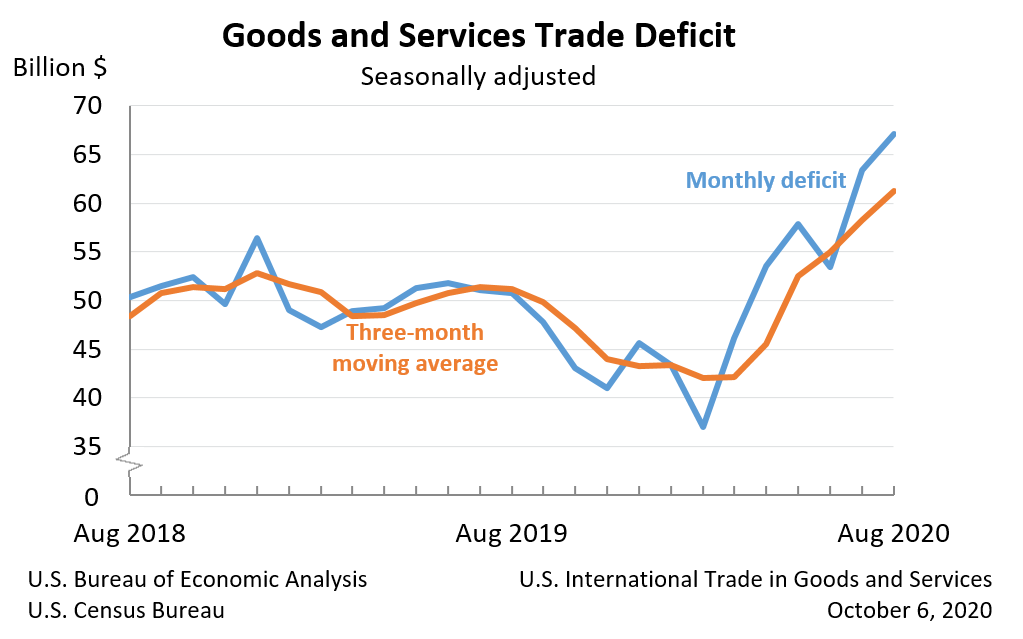
Trade deficit widens in August
The U.S. Census Bureau and the U.S. Bureau of Economic Analysis announced today that the goods and services deficit was $67.1 billion in August, up $3.7 billion from $63.4 billion in July (as revised). The two agencies cannot say how much of this might be related to the pandemic because such impacts "are generally embedded in source data and cannot be separately identified." That they almost certainly exist is seen at https://www.bea.gov/system/files/inline-images/trad0820.png
Monday, October 5, 2020
I'm back
I'm starting this blog over in a more restrained format. I'll be making short remarks based on the official reports on the Principal Federal Economic Indicators (PFEI). On Friday, the U.S. Bureauof Labor Statistics (BLS) released the Employment Situation for September.
At the top side, the unemployment rate "declined to 7.9 percent" and nonfarm payrolls declined by 661,000.
The most remarkable thing about the report was its this-is-just-another-data-point tone. A move of half a percentage point in the unemployment rate is Hope-diamond rare; there have been only five other such movements in the past two decades. In 2020, a half-point decline is treated in the press as a "slowdown" in what might well be what the Wall Street people call a dead-cat bounce after the 11.2 full percentage point increase between February and April.
None of these developments should be considered in the same light as more ordinary economic fluctuations. Their origin is in the public health policy in response to the CoVID-19 pandemic. The good news is that this will result in shorter posts in this blog. The bad news will appear tomorrow in A Slight Right.
Wednesday, August 31, 2011
Which end is in sight?
My absences grow longer, if not fonder. There hasn’t been much to excite any business cycle observer since my post at the end of last October. Despite some menacing feints, the economy has not slipped back into recession, but neither has it moved into a broad pattern of growth. The stubborn laggards are in housing and its related employment categories. The hesitant leaders are in factory production and its related utilization and productivity statistics.
As of August good news is outweighing bad by (very) roughly a 2-to-one margin. In my judgment, in really strong economy the ratio would be 4 (or more)-to- one. In our proprietary labor market index, there has been no sustained movement above a feeble upward trend that started at the end of 2009 and became evident in the moving averages in the first quarter of 2010. As of August, the labor market average was fractionally below its 6-month trailing moving average.
The economy’s stubborn insistence on sideways has caused me to wonder if there are deeper forces than the business cycle at work. A very thoughtful book by Robert D. Atkinson I recently reviewed for Monthly Labor Review (http://www.bls.gov/opub/mlr/2011/06/bookrevs.htm) is an interesting exploration of how longer waves of innovation affect the economy. My question is wheter or not we are at the fading end of the wave driven by the “entrepreneurial, knowledge-based” economy.
Earlier long waves have ended in tenacious recessions at intervals of about 50 years. By that timetable, the train is going off the rails a little early, but the computer revolution has speeded just about everything up, so why not its own long wave? Just thoughts.
Friday, October 29, 2010
Off the roller coaster?
I’m shocked to see that it’s been 3 months since I last posted. Yes, I’ve been busy, what with a fairly time consuming project with the Census Bureau to work on census coverage measurement and the renewal of thrice-a-week rugby coaching on the staff of my alma mater, but 3 months!
In the time since we last spoke, the National Bureau of Economic Research Business Cycle Dating Committee declared that June 2009 marked the trough of the recession. As readers of this blog know, NBER were very close to the truth; most likely there is no significant statistical or substantive difference between April and June. And so much for my nascent career as a BCD watcher.
Since NBER’s announcement, the economy went into a truly frightening stall. In the July 5 post, I was upset by a 9.9 index point drop in the Good News Index (GNI). Imagine how I would have felt if I had been paying attention the next month as the index fell by 33 points or the month after that as the 3-month moving average of the index dangled just fractions of a point above 50.
In September and October, the GNI moved back to the three-quarters to two-thirds range and the moving average came back to 63 and change in October. As I frantically worked to catch up on the index, I was heartened to see that there seems to be a growing flicker of life in the housing and related sectors, but less sanguine about the strength of the consumption-dependent sectors as consumers and lenders continue to restructure their revolving credit accounts.
The popping and only very slow reflation of what might be termed a conspicuous “consumption bubble” is a cycle that has been under-analyzed. How long will it be before a critical mass of consumers is willing to say, “I want that, and I’m willing to borrow to get it!”?
Monday, July 19, 2010
It's not whether or not you fall down, it's whether or not you get back up
Apparently, my renewed attention has not been sufficient to re-spark progress. Other than core prices remaining under control (a band of about half a percent either side of zero), the most recent reports have been worse than their immediate predecessors or were continued bad news.
Total nonfarm payroll employment declined by 125,000 in June, and the unemployment rate edged down to 9.5 percent. Our proprietary labor market index edged down for the first time in 4 months, and is desperately clinging to a place just above its trailing 6-month moving average. Mixed on the surface and neutral after an in-depth look.
Total construction activity for May 2010 was 0.2 percent below April. Bad.
Manufacturer’s shipments decreased 1.3 percent in May. New orders for manufactured goods decreased 1.4 percent. Bad.
May 2010 sales of merchant wholesalers were down 0.3 percent from April. Inventories were up 0.5 percent. Bad.
The Nation's international trade deficit in goods and services increased to $42.3 billion in May 2010, as imports increased more than exports. Bad, albeit for all the right reasons.
Retail and food service sales for June decreased -0.5 percent from the previous month. Bad.
Total business sales for May 2010 were down 0.9% from April. Bad.
The Producer Price Index for Finished Goods fell 0.5 percent in June. prices for finished goods rose 2.8 percent for the 12 months ended June 2010, their third straight month of slowing year-over-year advances. Good, especially as the monthly decline was strictly a food-and-energy thing.
The CPI declined 0.1 percent in June after falling 0.2 percent in May. The index for all items less food and energy increased 0.2 percent in June after increasing 0.1 percent in May. Good.
Real average weekly earnings fell 0.2 percent over the month of June. Bad.
Consumer credit decreased at an annual rate of 4-1/2 percent in May 2010. Bad.
Industrial production edged up 0.1 percent in June. The capacity utilization rate for total industry was unchanged. Neutral.
Import prices declined for the second consecutive month, dropping 1.3 percent in June. Export prices fell 0.2 percent. Neutral.
Monday, July 5, 2010
Stumbling through June
What’s up here? I get a good enough month at First XV Communications to put this blog on the back burner in June and things fall apart. The Good news index (GNI) fell by 9.9 index points during the month. Much of the accounting for the fall goes to the housing and related markets, but the rot seemed to be seeping into the durables factories as well. With the first major reports in July looking a bit dodgy as well (details in a later post), I guess I’ll just have to keep my nose to this particular grindstone, for the good of all.
In April 2010, wholesale trade edged up 0.7 percent over March. Good.
The Nation's international trade deficit in goods and services increased very slightly in April, as exports decreased more than imports. Bad all around.
Retail sales for May decreased -1.2 percent from the previous month. Bad.
Total business sales for April 2010 were up 0.6% from March. Good.
Manufacturing corporations' seasonally adjusted after-tax profits averaged 7.7 cents per dollar of sales for the first quarter of 2010, not statistically different from the fourth quarter of 2009. Neutral.
Housing starts in May 2010 10.0 percent below April. Awful.
After-tax profits for retail corporations averaged 3.0 cents per dollar of sales for the first quarter 2010, down 0.1 cents from the fourth quarter. Bad.
Sales of new one-family houses in May 2010 were 32.7 percent below the revised April rate. Truly awful.
New orders for manufactured durable goods decreased 1.1 percent in May. Alarmingly awful.
Import prices fell 0.6 percent in May. Fuel prices reversed the recent upward trend, falling 4.9 percent in May. In contrast to fuel prices, nonfuel prices continued to trend up in May, rising 0.5 percent. Everything is right on the knife edge between good and bad; rated as mixed or neutral.
The Producer Price Index for Finished Goods moved down 0.3 percent in May. Prices for finished goods rose 5.3 percent for the 12 months ended May 2010. This was the second consecutive month of slowing year-over-year advances. Good.
The Consumer Price Index for All Urban Consumers (CPI-U) declined 0.2
percent in May. The index for all items less food and energy increased 0.1 percent. Good.
Real average hourly earnings for all employees rose 0.5 percent from April to May. Real average weekly earnings rose 0.8 percent over the month. Good and better.
Real gross domestic product increased at a revised annual rate of 2.7 percent in the first quarter of 2010. Still good, but less good than we had thought.
Personal income and disposable personal income both increased 0.4 percent in May. Good.
Consumer credit increased at an annual rate of 1/2 percent in April 2010. Good.
Industrial production advanced 1.2 percent in May after having risen 0.7 percent in April. The capacity utilization rate for total industry rose 1.0 percentage point. Good.
Subscribe to:
Posts (Atom)